In the field of data analysis, we often encounter data that is structured in a hierarchy or tree-like manner. Hierarchical data organizes information in a […]
Category: Visualization
Three charts to elevate you Data Visualization
With the abundance of data available, it can be easy to overwhelm your audience. Therefore it’s crucial to use visualization techniques that not only capture […]
Two cool charts for dashboards
Dashboards play a crucial role in providing concise, real-time insights, enabling stakeholders to make informed decisions. Traffic light charts and gauge charts are valuable tools […]
A tale of two time charts
A timeline chart and a Gantt chart are both visual representations of chronological data over time, but they have different formats and use cases. Here’s […]
Mastering Project Management with Gantt Charts
In the realm of project management, the Gantt chart reigns supreme as a visual powerhouse. This versatile tool has been a steadfast companion to project […]
Unlock Project Management Success with these charts
In today’s fast-paced business environment, visualizing project timelines and performances is crucial for successful project management. In this context, versatility of three pivotal chart types […]
5 Unique Bar chart variants
Bar Chart is a very popular way of visualizing qualitative data. It displays data using rectangular bars where the length of each bar is proportional […]
Infographic chart in excel
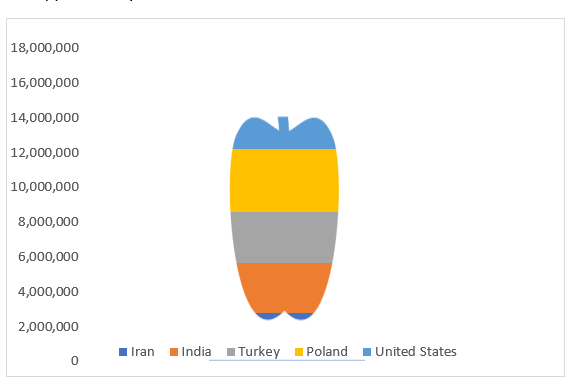
Infographics is visual representations that use a combination of graphics, images, text, and colour to present complex information in a clear, concise, and memorable way. […]
Spring chart in Excel
What is Spring Chart: Spring Chart is a beautiful way of representing your data in context to business KPIs. Its an alternate way of bar […]


