

A timeline chart and a Gantt chart are both visual representations of chronological data over time, but they have different formats and use cases. Here’s a comparison of timeline charts and Gantt charts:
Timeline Chart:
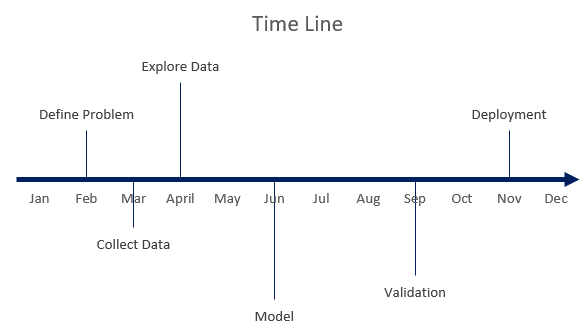
- Format: A timeline chart typically displays chronological data on a single horizontal axis, where time progresses from left to right. Events, activities, or milestones are represented as points or lines along the timeline.
- Representation: In a timeline chart, each event or activity is typically represented by a single point, line, or bar. The emphasis is on showing the sequence of events or milestones without specifying their durations.
- Use Cases: Timeline charts are often used to visualize historical events, highlight key dates, or provide a simple overview of a sequence of events. They are especially useful for showing the passage of time and events along that timeline.
- Granularity: Timeline charts are more suitable for displaying data with a broad chronological context but may not provide detailed information about the duration of specific activities or tasks.
- Complexity: Timeline charts tend to be simpler and less detailed than Gantt charts, making them easier to create and understand.
Gantt Chart
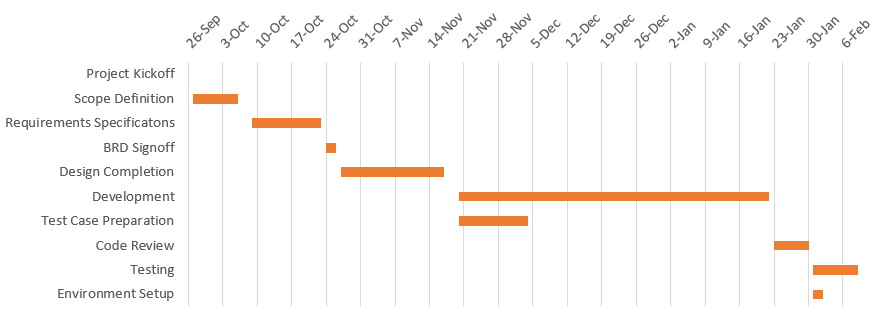
- Format: A Gantt chart is a more structured representation of chronological data, typically displayed as a horizontal bar chart. The horizontal axis represents time, while the vertical axis lists tasks or activities.
- Representation: In a Gantt chart, each task or activity is represented as a horizontal bar that spans the time it takes to complete. The length of the bars indicates the duration of each task, and they are arranged along the timeline to show when each task starts and ends.
- Use Cases: Gantt charts are commonly used in project management to plan, schedule, and track tasks and activities within a project. They are particularly effective for showing task dependencies, resource allocation, and the overall project timeline.
- Granularity: Gantt charts provide a detailed view of project or task scheduling, making them suitable for managing complex projects with multiple tasks, dependencies, and resource assignments.
- Complexity: Gantt charts can become quite complex, especially for large and intricate projects, which may require specialized software or tools for effective management.
In summary, timeline charts are best suited for providing a high-level view of chronological data and highlighting significant events or milestones, while Gantt charts are designed for detailed project scheduling and management, including task durations, dependencies, and resource allocation. The choice between a timeline chart and a Gantt chart depends on your specific needs and the level of detail required for your project or data representation.
